

Using Moving Averages in Trading
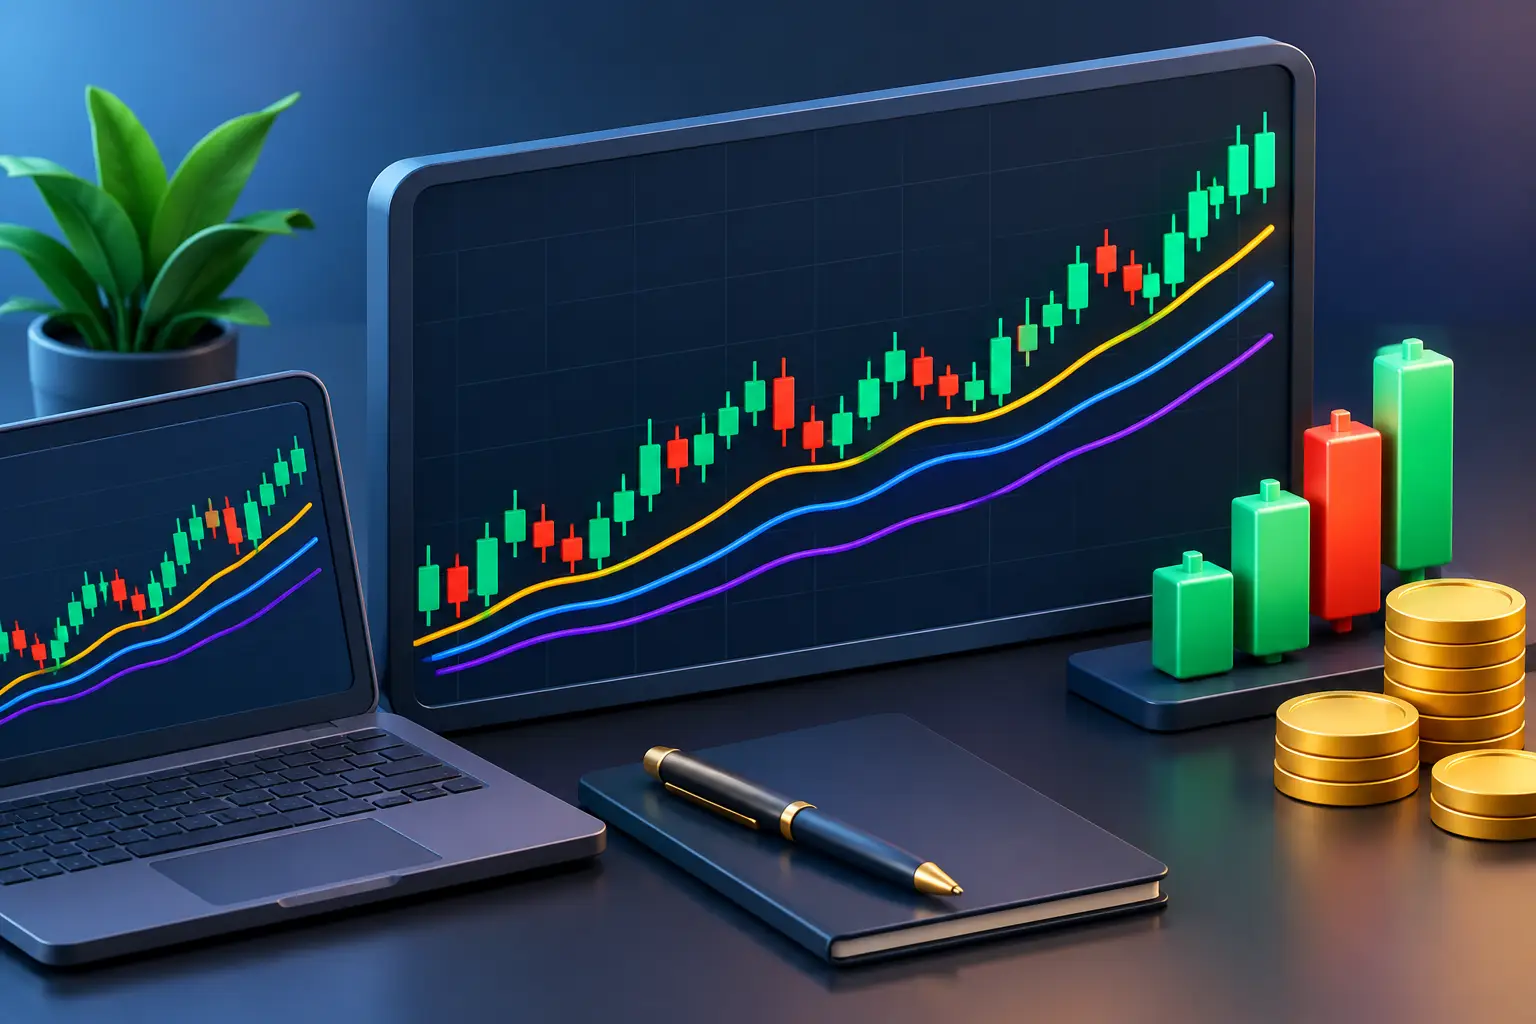
One rising candle on the chart still doesn't mean that the market is trending. Similarly, one sharp drop is not automatically a sell signal. Using a moving average helps a trader turn the daily noise of price into a clearer structure: to see direction, assess momentum, and make decisions based on predetermined rules.
A moving average indicator does not forecast the future. It shows the average value of prices that have already occurred, and therefore lags behind price. This very lag is both its main limitation and its advantage: the indicator often delays entries, but in exchange it reduces the number of premature and emotional actions.
What a moving average shows
A moving average combines the closing prices of a specific period and displays their average value. For example, a 20-period moving average takes into account the data of the last 20 candles. If the chart is hourly, this is 20 hours; if it's daily, it's 20 trading days. That's why the same parameter gives completely different information on different timeframes.
Traders mainly use it for three tasks: determining the direction of the trend, assessing the deviation of price from the average dynamics, and filtering trading signals. In an uptrend, price often maintains a position above the average line, while in a downtrend - below it. However, the word "often" is critically important here. In sideways movement, price constantly crosses the line and creates false signals.
SMA and EMA: a difference that changes decisions
The simple moving average, or SMA, assigns equal weight to every period. For example, in a 50-day SMA, the price from 50 days ago has the same influence as yesterday's price. Because of this, SMA is calmer and more stable, though it reacts slowly to new information.
The exponential moving average, or EMA, gives more weight to recent data. It responds faster to price changes, which can be useful for a short-term trader. At the same time, a faster reaction also means more noise: a signal based on EMA often appears earlier, but it isn't always higher quality.
The choice should be made according to your style. A swing trader who watches the daily or four-hour chart may need the 50 and 200 SMA for a clearer long-term picture. An intraday trader, on the other hand, often uses the 9, 20, or 50 EMA, since they want to react to the most recent price momentum. There is no single "best" parameter.
Using moving averages for trend
The simplest rule is this: first determine the direction, and only then look for an entry point. If price is above the 200-period average, the average itself is rising, and the structure forms higher highs and higher lows, the broader market context is more bullish. In such an environment, it's reasonable to give priority to buying scenarios.
In the opposite picture - when price is below the average, the line is declining, and price peaks are gradually decreasing - selling scenarios make more sense. This doesn't mean trading against the direction is forbidden. It simply means that a counter-trend position requires a smaller target, a strict stop-loss, and quick management.
It's useful to think in three layers. The long-term average gives us the market's direction, the medium-term average gives the quality of the current trend, and the short-term average gives the timing of the operation. For example, the 200 EMA can be a filter, the 50 EMA a working measure of the trend, and the 20 EMA the context for entry after a pullback. But three lines don't automatically create a strong system. If their purpose isn't defined in advance, the chart simply becomes overloaded.
Crossovers: a signal, not a verdict
The crossover of two moving averages is one of the most well-known signals. When the fast average crosses the slow average from below to above, this is often perceived as a bullish crossover. A crossover from above to below is a bearish signal. This approach can be effective in strong, extended trends, since it simplifies staying in a position.
Its weakness is visible in a sideways market. Price moves within a range, the averages cross several times, and each new signal cancels the previous one. During such periods, automatically entering on a crossover becomes a frequent source of small losses.
Therefore, evaluate the crossover together with context: is there clear support or resistance on the chart, has trading volume increased, does the signal match the direction of a higher timeframe, and is there an important macroeconomic event nearby. The indicator cannot replace price action.
Dynamic support and entry plan
In an uptrend, price often returns to the 20 or 50 period average, then continues rising. This is called dynamic support. In a downtrend, the same line can become dynamic resistance. The main mistake here is buying or selling just because price touched the line.
A more disciplined scenario includes three parts. First, there must be a trend. Then price must make a controlled correction toward the zone of the average. Finally, confirmation is needed - for example, a strong candle in the direction of the trend, a break of local structure, or an increase in volume. This way, the moving average becomes not an entry button, but a decision-making framework.
You shouldn't place a stop-loss randomly on the other side of the line itself. The market often slightly exceeds the average and then returns again. It's more logical to tie the stop to a structural level whose breach would invalidate your idea: the last low, the last high, or the boundary of the range. Then position size should be adjusted to the stop distance, and not the other way around.
What not to do
The most common mistake when working with moving averages is constantly changing the parameters. If the 20 EMA gives two losing positions and you immediately switch to a 17 EMA, and then to 34, you're no longer testing the system - you're simply looking for the desired answer on the past chart. The parameter should match the timeframe, the volatility of the asset, and your trading horizon, and then be tested on a sufficient number of examples.
The second mistake is using the indicator in isolation. For a crypto asset, a stock, or a Forex pair, price dynamics can be changed by an interest rate decision, a company's earnings report, reduced liquidity, or unexpected news. The average line reflects these factors only after price has already reacted.
The third mistake is ignoring risk. Even a good signal can turn out to be a loss. The acceptable loss per trade, the risk-to-reward ratio, position size, and an entry in a trading journal are important regardless of any indicator. If you don't record the results of a specific setup, over time you won't know whether your rule works in real conditions.
How to turn an indicator into a working rule
Start with one market and one timeframe. For example, choose a liquid stock or a major currency pair, define the 200 EMA as a directional filter and the 20 EMA as a pullback zone. Then write clear rules: when I don't trade, what must happen before entry, where the stop is placed, and how I lock in profit.
Then test this rule on historical charts, and only after that apply it in real time with small risk. In Traders' Hub's practical teaching, it is precisely this approach that creates the difference between simply recognizing an indicator and using it with discipline: the decision must be repeatable, measurable, and justified.
Ultimately, the best moving average is not the one that shows you every reversal in advance. The best one is the one that helps you reject low-quality ideas, protect your risk, and follow your trading plan even when the chart pushes you toward emotions.