

Support and Resistance Levels Made Simple
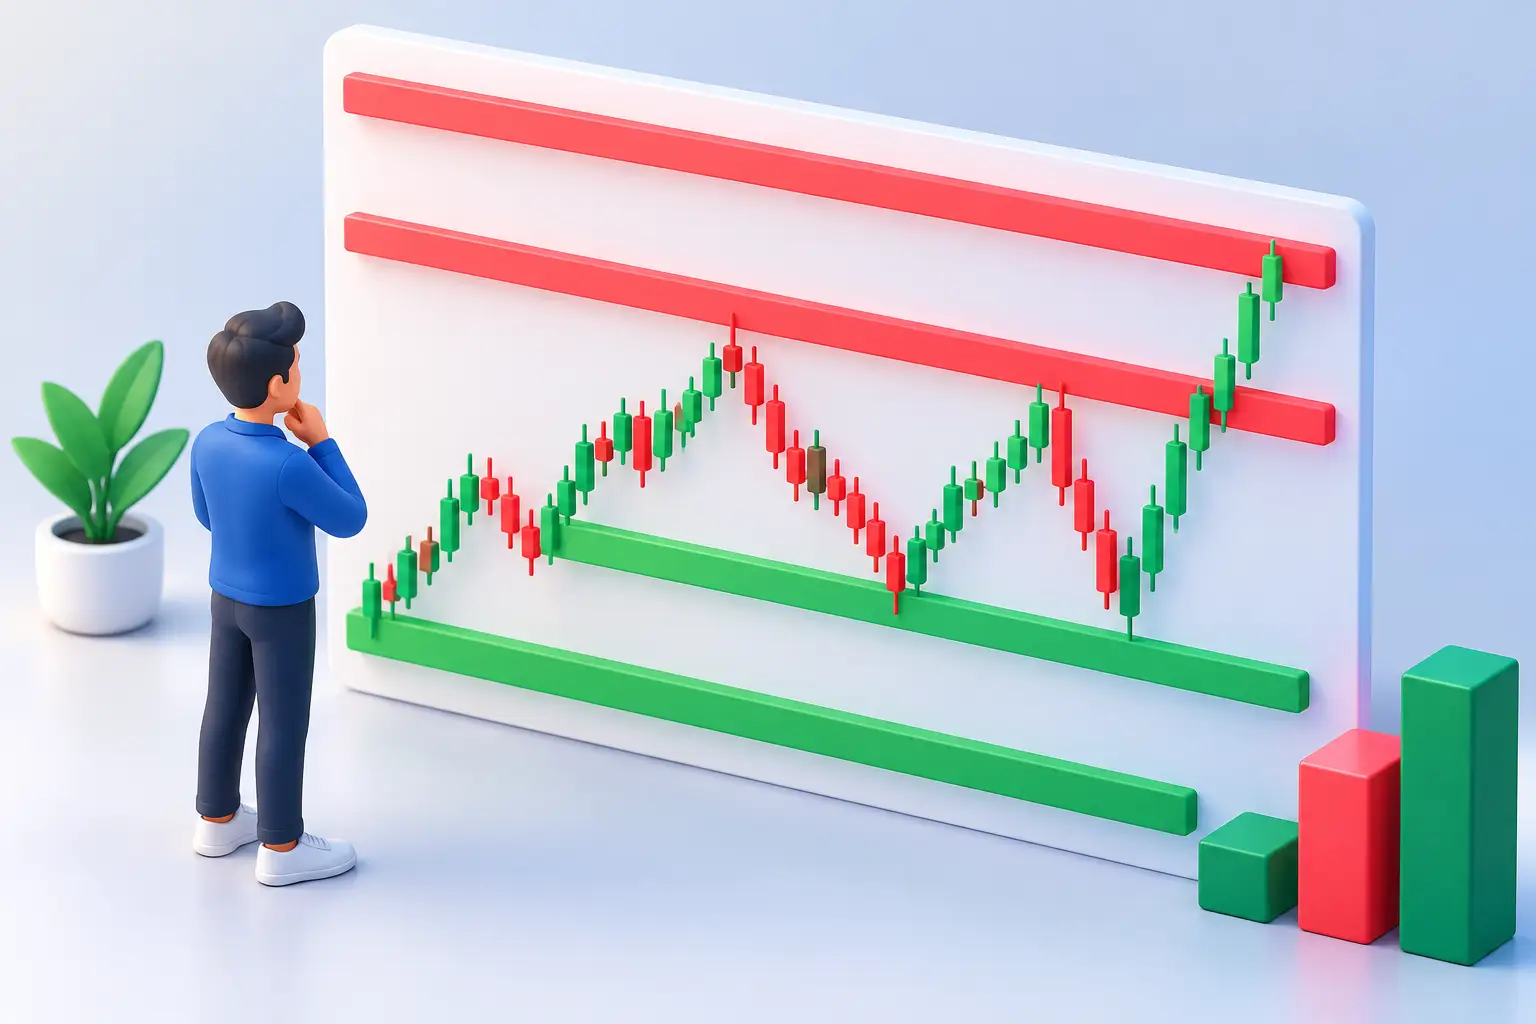
Not all lines on a price chart carry the same significance. Support and resistance levels are precisely the zones where market participants' decisions are most clearly visible: buyers become active, sellers lock in profits, or both sides wait for new information. Correctly identifying these levels doesn't mean you can predict the next move exactly. It means you'll build a more structured plan for trading.
The main advantage for a trader isn't the "accuracy" of a forecast but the quality of the decision. If you know in advance where price momentum might shift, where your trading idea loses strength, and where profit might be locked in, emotions have less control over your position.
What support and resistance mean
Support is a price or price range where demand has historically been sufficient to stop a decline. For example, if a stock's price comes down to $100 several times, buyers appear there and the price turns back up, the area around $100 can be considered a support zone.
Resistance works on the opposite logic. It's an area where supply increases and the upward movement of price stalls. If Bitcoin approaches the same level several times but can't hold above it, seller interest or profit-taking may be dominating there.
The key word is "range." The market rarely reacts to one exact number. Price may slightly overshoot a level, test liquidity, and then move in the opposite direction. That's why, instead of 100.00, it's more practical to mark a zone like 99.50-100.50, especially for highly volatile crypto assets.
Why support and resistance levels work
The foundation of this concept is market memory. Participants remember the prices where they previously made an important decision: bought, sold, missed an entry, or took a loss. When price returns to the same area, their reaction often repeats.
Imagine an investor who bought an asset at $50, and then the price fell to $40. If the price approaches $50 again, they might want to close the position to "break even." Many participants make the same decision, which creates selling pressure. That's why old support or resistance isn't merely a chart phenomenon - it reflects the trace of collective positioning.
However, levels don't work because every trader is watching the same line. They work because orders, profit-taking, stop orders, and new positions often converge in these zones. The more times and with the clearer volume price reacts to a specific area, the more attention it deserves.
How to mark important zones on a chart
Start from a higher timeframe. For a swing trader, this could be the weekly and daily chart, while for a short-term trader - the 4-hour and 1-hour chart. A level found on a 5-minute chart is often noise if it has no significance on a higher timeframe.
First, look for clear turning points: places where the price moved sharply up or down. Then observe how many times price returned to this area and what the reaction was like. Two touches are already noteworthy, but three or more reactions often make the level more reliable. This isn't a mathematical rule - strong macro news or a company's earnings can also prove decisive on just one touch.
Volume is an additional filter. If price got rejected from resistance on high volume, this indicates seller activity. If a level was broken on high volume and price established itself above it, the breakout carries more weight. In the Forex market, centralized volume isn't fully available, so traders should use price action, session timing, and the context of the economic calendar.
Also mark round numbers, for example 1.1000 on EUR/USD or 100,000 on Bitcoin. Orders often accumulate near such levels because they're easy for people to remember. But relying only on a round number isn't enough - check whether historical reaction also confirms it.
Entry: touching a line isn't a signal
The most common mistake is: price reached support, so automatically buy; it approached resistance, so automatically sell. This approach often leads to quick losses, because a strong trend breaks through levels.
A more disciplined approach is waiting for confirmation. At a support zone, you can watch for a strong bullish candle, a higher low, a false breakout, or increased volume. At resistance, opposite signs become important: a negative reaction, a lower high, or price returning below the zone after a breakout.
Choosing between the two practical scenarios depends on your style. An aggressive trader enters a position within the zone and uses a small, clear stop. A conservative trader waits for confirmation first, though they give up part of the better entry price. Neither approach is universally better. What matters is that the chosen method is defined in advance and applied consistently across many trades.
Breakout, retest, and false breakout
When price passes above resistance or below support, this is called a breakout. But the first move out doesn't yet confirm a new trend. The market often takes liquidity beyond an obvious level, triggers stop orders, and soon reverses in the opposite direction. This is a false breakout.
When evaluating a breakout, ask three questions: Did the candle close beyond the zone? Did volume or the momentum of the move increase? Was price able to remain on the new side after retesting the zone? Positive answers to these questions increase the probability of a successful breakout, though they don't create a guarantee.
A retest often provides a cleaner trading opportunity. For example, old resistance can turn into support after a breakout. If price returns to this area, buyers defend it, and the structure doesn't break, the trader has a clear place for both entry and risk definition. Sometimes a retest doesn't happen at all - in such cases, chasing price just so you don't miss the move is a bad habit.
Level and risk management as one system
Even the best support zone doesn't eliminate risk. That's why before opening a position you need to know three things: where you're entering, where your idea's invalidation point lies, and what a realistic target is. The stop-loss shouldn't sit exactly on the most obvious line, because liquidity often accumulates there. Its place is beyond the point where your scenario loses logic.
If you're buying from support, the first target is often the nearest resistance. This is where the need for a risk-reward ratio arises. Suppose the stop is 2 units away, while the first resistance is only 1 unit away. Then the idea might be technically interesting but not worth trading. Conversely, a risk of 2 units with a potential profit of 6 units creates a better structure, if the probability of success is also reasonable.
Don't increase a position just because price is "very close" to strong support. Capital preservation is the discipline that lets you take advantage of the next high-quality opportunity as well. In your trading journal, record the marked zone, the reason for entry, confirmation, stop, and result. After a few dozen trades, you'll already see which type of level and which scenario works better for you.
What not to do
Don't mark a chart with dozens of lines. If every price is both support and resistance, you won't be able to make a decision. Keep only those zones that are visible on a higher timeframe, connect to clear swings, or relate to an important price structure.
Don't ignore the news. A central bank decision, an inflation reading, an employment report, or a company's quarterly results can break through a technical level in seconds. On such days, you should reassess position size, stop distance, and even whether trading is necessary at all.
And finally, don't assume a level is permanent. Every test may weaken a zone, because part of the orders present there have already been executed. Sometimes the fourth or fifth touch is the best entry, and sometimes that's exactly when the breakout happens. The answer lies in price action, not blind trust in a line.
Start using support and resistance not by adding more indicators, but by making fewer, better-justified decisions. Mark a few important zones, wait for price reaction, and define risk in advance for each trade. This is exactly how a chart transforms from a space of guesswork into a working plan.